Have You Heard of the “Journal Transparency Index”?

A new metric will be launching from the Center for Open Science focusing on scholarly journals and measuring their commitment to research transparency, according to a recent article entitled, “Journal transparency index will be ‘alternative’ to impact scores.” (January 29, 2020)

The background for this measurement can be found with the Transparency & Openness Promotion (TOP) guidelines, a metric that reports the steps that a journal takes to implement open science practices. In reviewing the list of TOP Implementors, as of June 2019, there were over 1,100 journals that have applied one or more TOP-compliant policies including Science (AAAS), and many Nature Springer titles.

The guidelines cover eight transparency standards (citation, data transparency, analytic methods (code) transparency, research materials transparency, design & analysis transparency, preregistration of studies, preregistration of analysis plans, and replication).  Within each standard, there are three levels of implementation (also referred to as levels of increasing stringency), as well as a “not implemented” category. The higher the score in this evaluation rubric, the higher level of support the journal publisher is providing in promoting and encouraging open science.

Among these measures of assessment is data sharing, wherein a journal could score up to three points.  In order for this to happen, a data availability statement must be included, authors would be required to share their data, and the study should be reproducible based on the data provided.

As with any measurement, time ultimately is required to determine the impact of this journal assessment or score.  This ranking system might very well contribute to research transparency and is a step in the right direction in supporting the reproducibility crisis.

Donna Gibson
Director of Library Services
Good-bye 2019 and Welcome 2020!

Happy New Year to our User Community and our Library Blog Readers. I’d like to spend some time reflecting on last year’s accomplishments and research support provided by library staff by sharing some key library metrics and updates we track. Our physical space had over 110,700 in-person visits, which was an increase of over 7,000 visits in 2018.  Our website saw an increase of close to 600 virtual visits going from 41,768 (2018) to 42,355 (2019).

Most impressive was usage of the electronic journal collection by MSK staff.  In 2019, we recorded 1,922,211 downloads of full text articles and this count doesn’t include December usage. In comparison, in 2018, 1,920,937 journal articles were downloaded showing an increase of 1,274.  However, if you take the average downloads per month to account for the missing usage for December 2019, this brings the increase for 2019 to about 176,020. Now that’s a metric!

As for research requests, the Research Informationist team received 916 emails and while this number was slightly higher in 2018 (924), the amount of time devoted to conducting, interpreting, and sending on-target results increased by over 44 hours in 2019 (1,636 hours in 2019).  These client interactions do not include requests we receive via Ask-a-Librarian, chat, phone, or in-person conversations.

While we maintain a very focused journal collection, we enhance this collection by obtaining journal articles and other content (books, book chapters, dissertations, etc.) via Document Delivery Services (DDS). Our client requests for content outside our collection went down slightly in 2019. The DDS team filled 12,874 requests in 2019 and 13,001 in 2018. Most individuals don’t like to see a metric decrease, but in this case, we can attribute the lower number to our users leveraging the current collection and what they can access instantly!

We also achieved our defined 2019 goals.  Synapse now includes a Research Activity Dashboard for both groups and individuals. We finished the 2018 Synapse Publications report and managed to ingest four years of retrospective content!  ILLiad (Document Delivery) was upgraded and we implemented client feedback from usability testing to improve ONESEARCH, our search and discovery tool located on the library websiteONESEARCH enables users to search multiple MSK collections through a single search box.

We were able to get our beta version of the MSK Data Catalog up and running and look forward to launching this resource in 1Q2020.  And finally, we started work on our client and metric tracking system which we also hope to launch in 2020. This system will improve how the library staff handles all our client requests.

As we do every year, in 2020 we will continue to focus on the day-to-day operations of the MSK Library and on our commitment to engage our user community to better understand their information needs. We look forward to hearing from you.  Better yet, we look forward to partnering with you to see how we can integrate library resources and services in your day-to-day workflows!

For any questions regarding our collections or services, don’t hesitate to ASK US.

Donna Gibson
Director of Library Services

New Feature Now Available on Synapse!

It’s the holiday season and a time for reflection, sharing good cheer, spending time with family and friends, and perhaps delighting someone with a special gift.

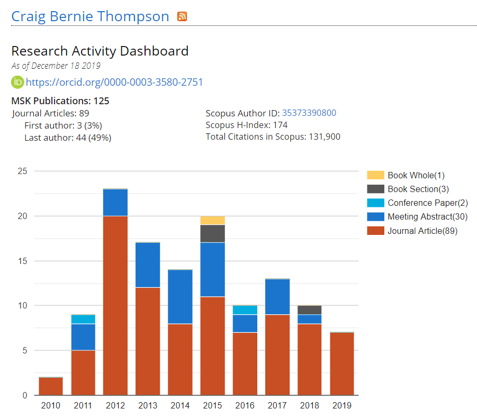
With this in mind, we are excited to share and hopefully delight our library community by announcing that the Synapse Research Activity Dashboard (RAD) is now available. The RAD can be viewed at the group level, as well as the individual (author) level.

Synapse is the authoritative resource for MSK publications and currently includes content (works) dating back to 1991.

What does the RAD include? When viewing a group, you’ll be presented with team members and counts for all their MSK publications, or you can select by current year-to- date, or the past year. In addition, the research works have been broken down to showcase first author and last author positions on their papers.  There are also links to other metrics, as well as the author’s RAD.  The individual’s RAD includes a chart illustrating publication formats (Book, Meeting Abstract, Journal Article, etc.) by year.  Please note the individual’s RAD only includes the author’s MSK-affiliated publications.

If you’re curious, you can learn more about the metrics we display and feel free to let us know what you think! Feedback is most welcome as we plan to continue to work with Synapse users to further enhance the Research Activity Dashboard.

Donna Gibson
Director of Library Services