Return to Today's science sparks archives
 Click the tweet icon above each article title to share it on Twitter.
|
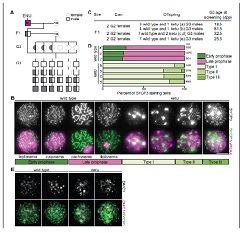
Figure 1. Mice from the ENU-induced mutant line ketu have meiotic defects.
|
 |
|
Figure 2. Possible Mechanisms Underlying Immune-Related Adverse Events.
|
|
|
Fig 3. HPV-positivity in a usual type adenocarcinoma using the ACD RNAscope probe HPV HR18.
|
|
|
Fig 1. Remote physical assessment: technologies, sensor modalities, and application domains.
|
|
|
Fig 1. Structures of 5-A-RU (1), the Schiff base it forms with methylglyoxal (5-OP-RU), and the covalent attachment of the latter to MR1.
|
|
|
Fig 1. Molecular response rates at 3, 6, 9, and 12 months (modified intent-to-treat population).
|
|
|
Fig 1. Characterization of four distinct mutational signatures in breast cancer.
|
|
|
Fig. 5 Differential diagnoses of hepatosplenic T-cell lymphoma (HSTCL).
|
|
|
Fig 4. Intact TLR3- and IFN-Responsive Pathways, and Very HighRNALariat Levels in DBR1-Deficient Fibroblasts following HSV1 Infection.
|
|
|
Fig 1: Risk predictions from super leaner analyses for 9,651 patients at risk for: (i) acute GVHD within 100 days, and (ii) the composite endpoint of acute GVHD and death within 100 days.
|
|
|
Figure 1. Flow diagram. *Numbers do not add up to 373 because there is overlap among patients with missing information for each variable. ITMIG, International Thymic Malignancy Interest Group; PN/AI, paraneoplastic/autoimmune syndrome.
|
|
|
Figure 1: Timeline of key developments in therapeutically targeting RET in the clinic.
|
|
|
Fig. 1 Regulation of mTORC1 and nutrient-scavenging pathwaysby TM9SF4.
|
|
|
Fig. 6. FA proteins regulate recruitment of DSB repair proteins to sites of replication-associated DNA damage in U2OS cells.
|
|
|
Fig 2. An array of salvage regimens for RRMM comprising proteasome inhibitor (PI), immunomodulatory agents (IMiD), anti-CD38(daratumumab [Dara]) or anti-SLAMF7 (elotuzumab [Elo]) monoclonal antibodies, BCL2 inhibitor (BCL2i), exportin-1 inhibitor (XPO1-i), anti-PD1 check-point inhibitors or CAR-T cells.
|
|
|
Fig. 1. Post-IND1 hepatotoxicity in patients who completed at least IND2 and had post-IND1 hepatotoxicity.
|
|
|
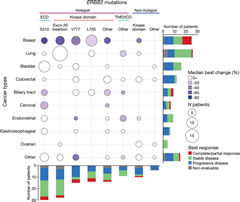
Fig 2. Integrated efficacy by tumour type and HER2 allele/domain.
|
|
|
Fig. 17.1: Summary of main steps of DNA replication initiation in budding yeast.
|
|
|
FIG 1.Path diagram of hypothesized medication model of the effect of Meaning-Centered Group Psychotherapy (MCGP) on patients’ outcomes.
|
|
|
Fig 1. Elements of the ImmunoMap algorithm.
|
|
|
Figure 5. Harmine leads to degradation of the E2A proteins, which are required for suppression of OIS.
|
|
|
Fig 2. An example of a BREAST-Q result for a patient who underwent breast reconstruction.
|
|
|
Fig. 1. HET-C2 Trp locations compared to GLTP.
|
|
|
Fig 3. PPP1R1A promotes cell migration and tumor metastasis in ES.
|
|
|
Fig. 5: MDA-MB-231 cells
stained using DAPI, anti-dsDNA antibody,
or mCherry–lamin B2 (arrow).
|
|
|
Fig. 4. TP63 abnormal RT is not dependent on progerin expression and is observed in other progeroid syndromes.
|
|
|
Fig. 1—67-year-old man with newly diagnosed occlusive cancer in descending colon.
|
|
|
Fig 1. Hedvig Hricak, Memorial Sloan Kettering Cancer Center.
|
|
|
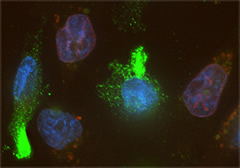
Figure 1. Scanning electron micrograph of chimeric antigen
receptor T cells pseudocolored (green) attacking a cultured
mesothelin-overexpressing malignant mesothelioma cell.
|
|
|
Fig 2: Interactions with
AdoHcy (sticks with cyan carbon atoms).
|
|
|
Fig. 1. Clinical outcomes by National Comprehensive Cancer Network risk group for (A) prostate-specific antigen (PSA) recurrence–free survival, (B) distant metastasis–free survival, (C) overall survival, and (D) and cancer-specific survival. Abbreviation: RT = radiation therapy.
|
|
|
Fig. 1.1: SV40 and cellular DNA replication.
|
|
|
Fig 5: Heat map combined with regression analysis of metabolism-related pathways for the 20 MSKCC Director’s Challenge samples of lung adenocarcinoma with available PET SUV data.
|
|
|
Figure 2. Initial grade 2 rash (not shown) with combination therapy progressing to grade 3 rash with anti-programmed death 1 (PD-1)rechallenge.
|
|
|
Figure 1. A sample workflow for informatics in cancer immunotherapy.
|
|
|
Fig. 1. Kaplan-Meier survival analysis.
|
|
|
Figure 2. Cellular stress can trigger astrogliosis—increased numbers of reactive astrocytes.
|
|
|
FIG. 1. Significance of selecting NP.
|
|
|
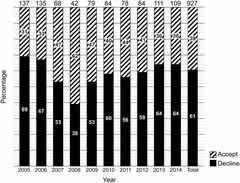
Figure 1. Acceptance of treatment for latent tuberculosis infection by year of diagnosis.
|
|
|
Fig 2. Postoperative radiotherapy plans for a patient with salivary duct carcinoma of the left accessory parotid gland.
|
|
|
Fig 1. Bi-allelic pathogenic alterations affecting HR-related genes affect multiple cancer types and are associated with genomics features of HR deficiency.
|
|
|
Figure 1. Significance of selecting NP.
|
|
|
Figure 3. Interactions with the guanine nucleobase, GDP phosphates, and magnesium.
|
|
|
Figure 1.Schematic representation of NK-cell functions in neuroblastoma (NB).
|
|
|
FIG. 1. Treatment with SRS to a previously cement-augmented vertebra.
|
|
|
Figure 6. Akt3/−S472 enhances EGF-stimulated EGFR endocytosis.
|
|
|
Figure 1. Shutting down stem and memory genes in CD8+ T cells.
|
|
|
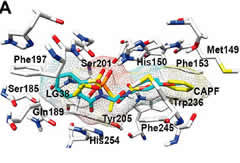
Figure 2. Docking of saccharin-based inhibitors into the active site of the rhomboid protease GlpG.
|
|
|
Figure 1. Design concept of folate-assisted on target drug delivery.
|
|
|
Fig 1. Treatment algorithm for non-muscle invasive bladder cancer.
|
|
|
Fig. 4. Defects in mesoderm migration in Strip1 mutant embryos.
|
|
|
Figure 6. Near complete penetration of the Cre-recombinase in PdxCre;R26DTR/mTmG mice.
|
|
|
Fig 1. Regulation of ferroptosis by cellular metabolism.
|
|
|
Figure 5. Clinical response to mIDH2 inhibition is associated with induction of myeloid differentiation.
|
|
|
Fig 5. Example of separation surgery followed by stereotactic spine radiotherapy in a patient with spinal cord compression.
|
|
|
Figure 1. Plasma concentration of ASP8273 in patients in the dose escalation cohorts after a single dose of ASP8273.
|
|
|
Figure 1. Cavity in the BPTI protein, with waters A, B, and C bound.
|
|
|
Fig 1. Two overlapping connectivity envelopes surround the patient.
|
|
|
Fig 2. Kaplan-Meier curves of (A and B) overall survival (OS) and (C and D) progression-free survival
|
|
|
Fig 4. Distribution of kinase fusions across primary tumour sites.
|
|
|
Fig 3. (A) Photon flux enhancement of 89Zr through the combination with E8 gels at various concentrations. (B) Photon counts of E8 gels having different E8 gelator concentrations in the presence of the 89Zr radionuclide.
|
|
|
Fig 1. Extrathyroidal extension (ETE). A,B, Gross ETE: a patient with papillary thyroid carcinoma (PTC) with pre-operative radiological evidence of invasion into trachea. Macroscopically (A), an infiltrative firm beige mass was present involving thyroid gland proper and infiltrating between tracheal rings (T). Microscopically, the carcinoma infiltrated in between tracheal cartilage and was present at the tracheal mucosal surface. This tumour should be staged as pT4a based on gross ETE into trachea. C,D, Microscopic (minimal) ETE: tumour nests were present in between perithyroidal adipose tissue (FAT, panel C) or skeletal muscle (M, panel D).
|
|


![Fig 2. An array of salvage regimens for RRMM comprising proteasome inhibitor (PI), immunomodulatory agents (IMiD), anti-CD38(daratumumab [Dara]) or anti-SLAMF7 (elotuzumab [Elo]) monoclonal antibodies, BCL2 inhibitor (BCL2i), exportin-1 inhibitor (XPO1-i), anti-PD1 check-point inhibitors or CAR-T cells.](https://library.mskcc.org/sparks/sparksimgs/4004/sparksmar09.jpg)