Return to Today's science sparks archives
 Click the tweet icon above each article title to share it on Twitter.
|
Fig 2. Architecture of Orai. (A) Ribbon representation showing the tertiary structure of the channel from the side.
|
|
|
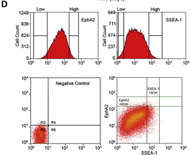
Fig 2. Enrichment of the Stem-like Tumorigenic Pool Based on EphA2 Level. (D) Cells from the same hGBM were sorted and gated according to EphA2 and SSEA-1 levels.
|
|
|
Fig 1: Large T antigen is not an obligate double hexamer during replication. A. Models for DNA unwinding by large T antigen (T-ag). See main text for details.
|
|
|
Fig 3. Disseminated intravascular coagulation (DIC) is common in patients with t(8;16) AML. Overall survival correlates with the degree of presenting fibrinogen levels (r2 = 0.90; data plotted for 8 patients only with available presenting fibrinogen level) (A) (all patients with DIC died, no censored patients).
|
|
|
Fig 1. Urothelial carcinoma in situ with denudation.
|
|
|
Fig 1a. Quantitative real-time PCR was used for the detection of miR-101 and COX-2 mRNA expression. In each sample, miR-101 expression was normalized against U6 RNA, and COX-2 mRNA expression was normalized against GAPDH mRNA.
|
|
|
Fig 3. Binding of 3F8BiAb to ATC and target cells.
|
|
|
Fig 2. Disease free (A) and overall survival (B, C) with concurrent carboplatin/paclitaxel and intravaginal radiation for uterine papillary serous cancer (n = 41 patients).
|
|
|
Fig 1. Various staging algorithms for localized gastric cancer and estimated associated costs.
|
|
|
Fig 1. Average distances from parathyroid adenomas to the recurrent laryngeal nerve.
|
|
|
Fig 1a. Diagram of the calibration setup. The custom polystyrene phantom is shown with foil.
|
|
|
Fig 2b. Raman intensity maps of a single RAW 264.7 macrophage 32.4 min after introducing nanotubes.
|
|
|
Fig 1a. Dose-volume histogram for the target volumes (PTV57.6) using whole-neck field IMRT (WF-IMRT) and junctioned IMRT (J-IMRT).
|
|
|
Fig 1. Forest plot of individual PanC4 studies—odds ratios (ORs) and 95% confidence intervals (CIs) for pancreatitis (diagnosed >2 years before) and risk of pancreatic cancer.
|
|
|
Fig 1. Trial design is depicted.
|
|
|
Fig 1. Box-and-whisker plot of total hemoglobin concentration distribution in 136 malignant and benign lesions.
|
|
|
Fig. 2. Proposed strategy to incorporate perioperative systemic therapy for cisplatin-ineligible or refusing patients with urothelial carcinoma of the bladder (UCB).
|
|
|
Fig 1. Breakdown of bone densitometry diagnoses at baseline and over the course of CC therapy (BD, bone density).
|
|
|
Fig 2A.Changes in NTX over time relative to diagnosis of ONJ (restricted to patients with 3 or more blood draws; n = 33).
|
|
|
Fig 2a. Confirmed maximum reduction in intracranial target lesion for patients with Val600Glu BRAF-mutant melanoma and brain metastases in cohort A.
|
|
|
Fig 7. Nodal knockdown mitigates progression to macrometastases. (B)GUSB staining to confirm human origin of lesions showing 231+shControl macrometastasis formation after 8 weeks.
|
 |
|
Fig 5 . Visual predictive check (VPC) of 10,000 simulated patients (A) on placebo before their switch to everolimus.
|
|
|
Fig 1a. Representative full-transverse section of proximal jejunum from Lgr5-lacZ transgenic mice stained for lacZ. LacZ+ CBCs are visible at the crypt base (blue cells with arrow).
|
|
|
Fig 1e. Histopathologic correlate showing a cystic variant of a BCC with basaloid tumor cells arranged in nests. Areas of mucin deposition (white asterisk) can be observed surrounding the tumor islands and forming cystic spaces (black asterisk).
|
|
|
Fig 1. Number of sentinel lymph node biopsy-positive patients with omission of axillary lymph node dissection by year.
|
|
|
Fig 1. Major capsular and vascular invasion with high mitotic activity confirming diagnosis of parathyroid carcinoma.
|
|
|
Fig 1c. Changes in 5hmC and 5mC are associated with site-specific hypermethylation and transcriptional silencing in normal individuals with TET2 mutations, as measured by MassArray Epityper (left) and quantitative RT-PCR (qRT-PCR, right) analyses in the PMNs of six individuals with WT TET2 and six with mutant (mut) TET2.
|
|
|
Fig 4a. Heatmap of the nine-signature genes (annotated on the right) in the 94-patient samples assessed with TaqMan probes.
|
|
|
Fig 2. G arm quality of life sensitivity analysis.
|
|
|
Fig 1. BEZ235 induces dose and time dependent cytotoxicity in 8 thyroid cancer cell lines.
|
|
|
Fig 2. Flow cytometric measurements of γH2AX in PB cells.
|
|
|
Fig 3a. Axial T2 weighted MRI image of the prostate gland at the level of the apex and with endorectal coil in situ.
|
|
|
Fig 1. Gli3−/− hindlimbs develop polydactyly and severe AP patterning defects only in the anterior zeugopod and autopod.
|
|
|
Figure 4a. The Exosome Central Channel Is Essential In Vivo.
|
|
|
Fig 1. VCAM-1 expressed in breast cancer cells mediates lung and bone metastasis by interacting with stromal leukocytes that express α4 integrin counterreceptors.
|
|
|
Fig 2. Structure of (ziv-)aflibercept. Fc, fragment, crystallizable region; IgG, immunoglobulin G; VEGFR, vascular endothelial growth factor receptor.
|
|
|
Fig 4(A). Relative Priming of AML Determines Clinical Outcome.
|
|
|
Fig 2. 53bp1 is a haploinsufficient tumor suppressor in a glioma mouse model.
|
|
|
Fig 5. Fluorescence-guided, stepwise resection of an RCAS-PDGF glioblastoma using IRDye 800CW-RGD peptide NIRF imaging
|
|
|
Fig 6. A model of U1 snRNP-mediated p14 suppression.
|
|
|
Fig 1. Brain MRI demonstrates a well-circumscribed, T1- and T2-isointense, contrast-enhancing lesion at the craniocervical junction.
|
|
|
Fig 4(C2). Growth inhibition of TPC-1 cells and tumors by AZD1480 is independent of activated phospho-STAT3 Tyr705.
|
|
|
Fig 2a. SET-2 and SET-2 INPer cells were washed and incubated for 4 h with increasing concentrations of INCB18424 and western blotted. MAPK, mitogen-activated protein kinase.
|
|
|
Fig 1. Chemical structures of the GSI BMS-708,163 and the inhibitor-based photoaffinity probe 163-BPyne used in this study.
|
|
|
Fig 5. Microenvironmental features within tissue sections of FaDu tumors at early and late time points postinjection of copper-64-diacetyl-bis(N(4)-methylthiosemicarbazone).
|
|
|
Fig 1. Sample isodose curves of dose-painting intensity modulated radiation therapy (DP-IMRT) and sequential IMRT plans for 3-year-old patient with pelvic rhabdomyosarcoma (axial and coronal planes).
|
|
|
Fig 5. Synergy between 4-OH-OPB and known TB drugs in killing Mtb.
|
|
|
Fig 3. Percentage of trials recommending each dose level based on simulated trials comparing 3+3 with CRM under type A and B errors.
|
|
|
Fig 2. Time spent hospitalized as percent of survival of the oldest PCNSL patients.
|
|
|
Fig 1b. GBM is a heterogeneous tumor composed of multiple cell types, including both tumor and stromal cells.
|
|
|
Fig 1. At the indicated time points, total numbers and frequencies of CD4+ Foxp3+ Tregs were determined by flow cytometry in LALs (A) and splenocytes (B).
|
|
|
Fig 1. Axial views at central axis (below) and 6 cm superior to central axis (above) showing isodose lines from representative left-sided treatment plans of patients without reconstruction (UNR) and with reconstruction (REC) with and without internal mammary node (IMN) treatment.
|
|
|
Fig 1a. Image of a high grade undifferentiated uterine sarcomas demonstrating features of endometrial stromal differentiation but a high mitotic rate and severe nuclear atypia.
|
|
|
Fig 4. Effects on cancer cell viability and proliferation.
|
|
|
Fig 3. Analysis of Olig2::Egfp-L10a translational profiles in normal brains and tumors identifies candidates for differentiation and quiescence of OPCs.
|
|
|
Fig 2. Kaplan–Meier curve for overall survival in patients with advanced stage (IIIB/IV) disease.
|
|
|
Fig 2a. Stage-dependent effects of Dynein on muscle length and myonuclear positioning.
|
|
|
Fig 3. Sclerosing Spitz nevus with epithelioid melanocytes adjacent to a lymphocytic aggregate.
|
|
|
Fig 15.1. Phase II trial of tanespimycin and trastuzumab in metastatic trastuzumab-refractory HER2 positive breast cancer.
|
|
|
Fig 2. Sparse regression models predict differential expression of held-out genes and subtypes of tumor samples.
|
|
|
Fig 3. Distribution of electroretinograms (ERGs) before ophthalmic artery chemosurgery and change (>25 µV) in ERGs after ophthalmic artery chemosurgery.
|
|
|
Fig 1. Urine was fractionated by cation exchange chromatography and fractions containing immunoreactive neutrophil gelatinase–associated lipocalin (NGAL) species were then separated by filtration chromatography (left panels).
|
|
|
Fig 1a. GLV-1h153 infects, replicates within, and shows oncolytic activity against multiple TNBC cells in a dose-and time-dependent fashion in culture. Viral infection in a representative cell line, MDA-MB-231, is time dependent.
|
|
|
Summary of canonical and splicing-mediated miRNA pathways.
|
|